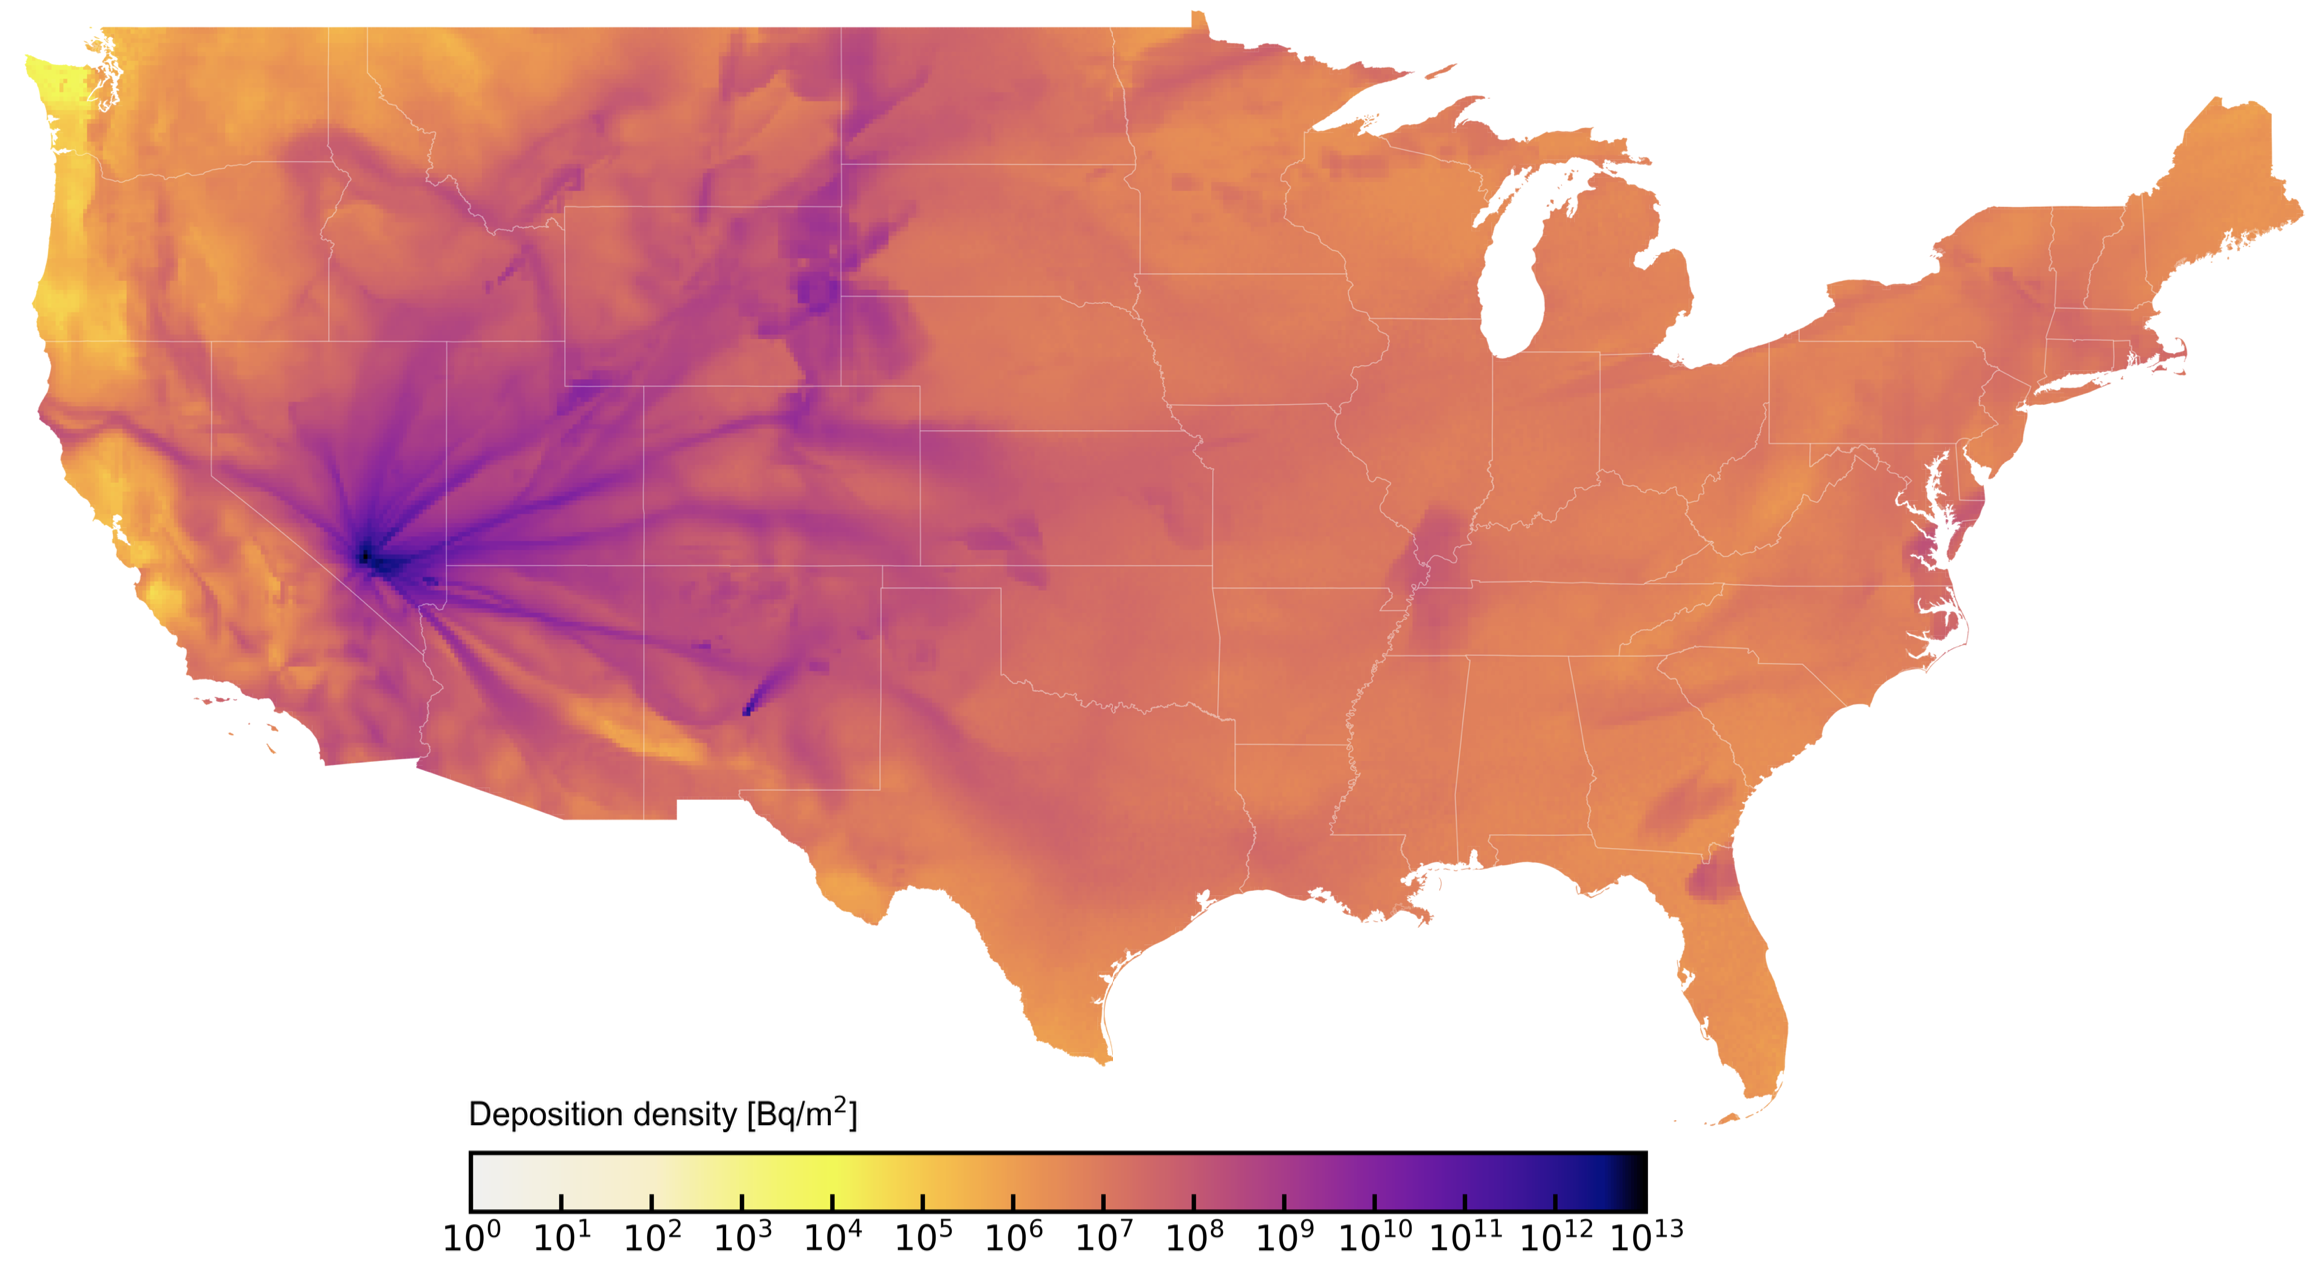
A map depicting composite deposition of radioactive material across the contiguous U.S. from the Trinity test in New Mexico and from 93 atmospheric tests in Nevada.
Source: Science & Global Security
A map depicting composite deposition of radioactive material across the contiguous U.S. from the Trinity test in New Mexico and from 93 atmospheric tests in Nevada.
Source: Science & Global Security